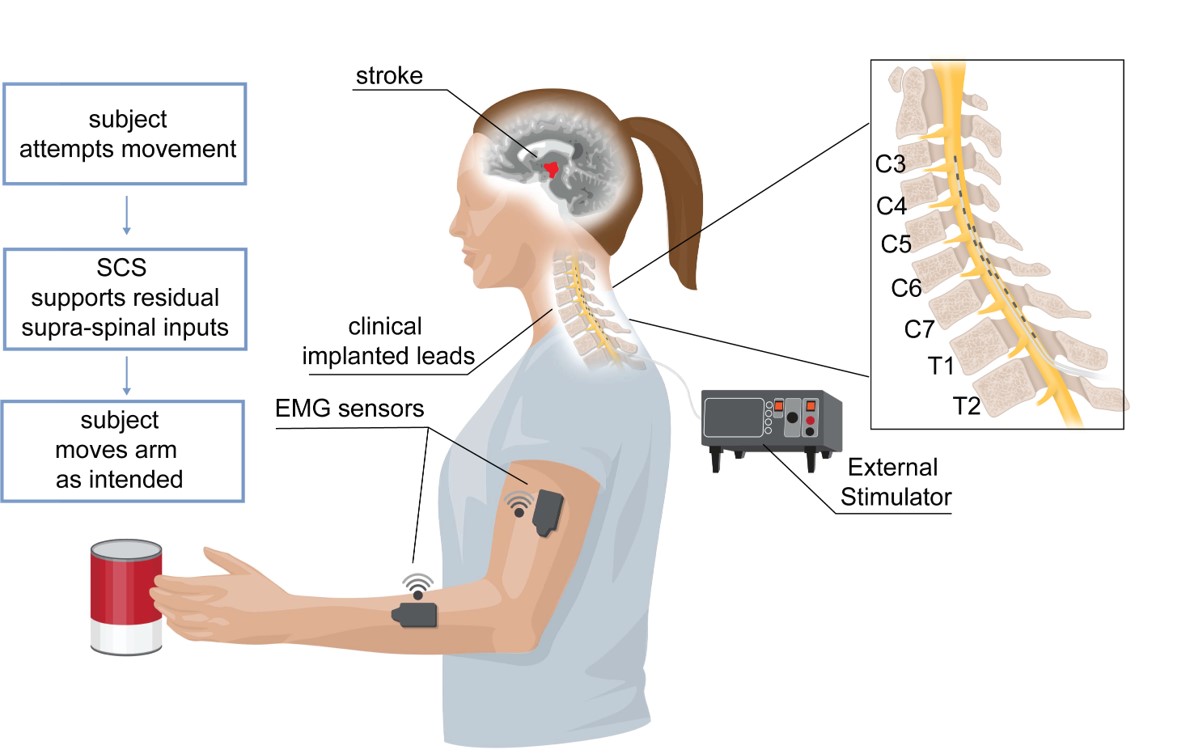
Real-time neuromusculoskeletal model for myoelectric control of ankle prosthesis
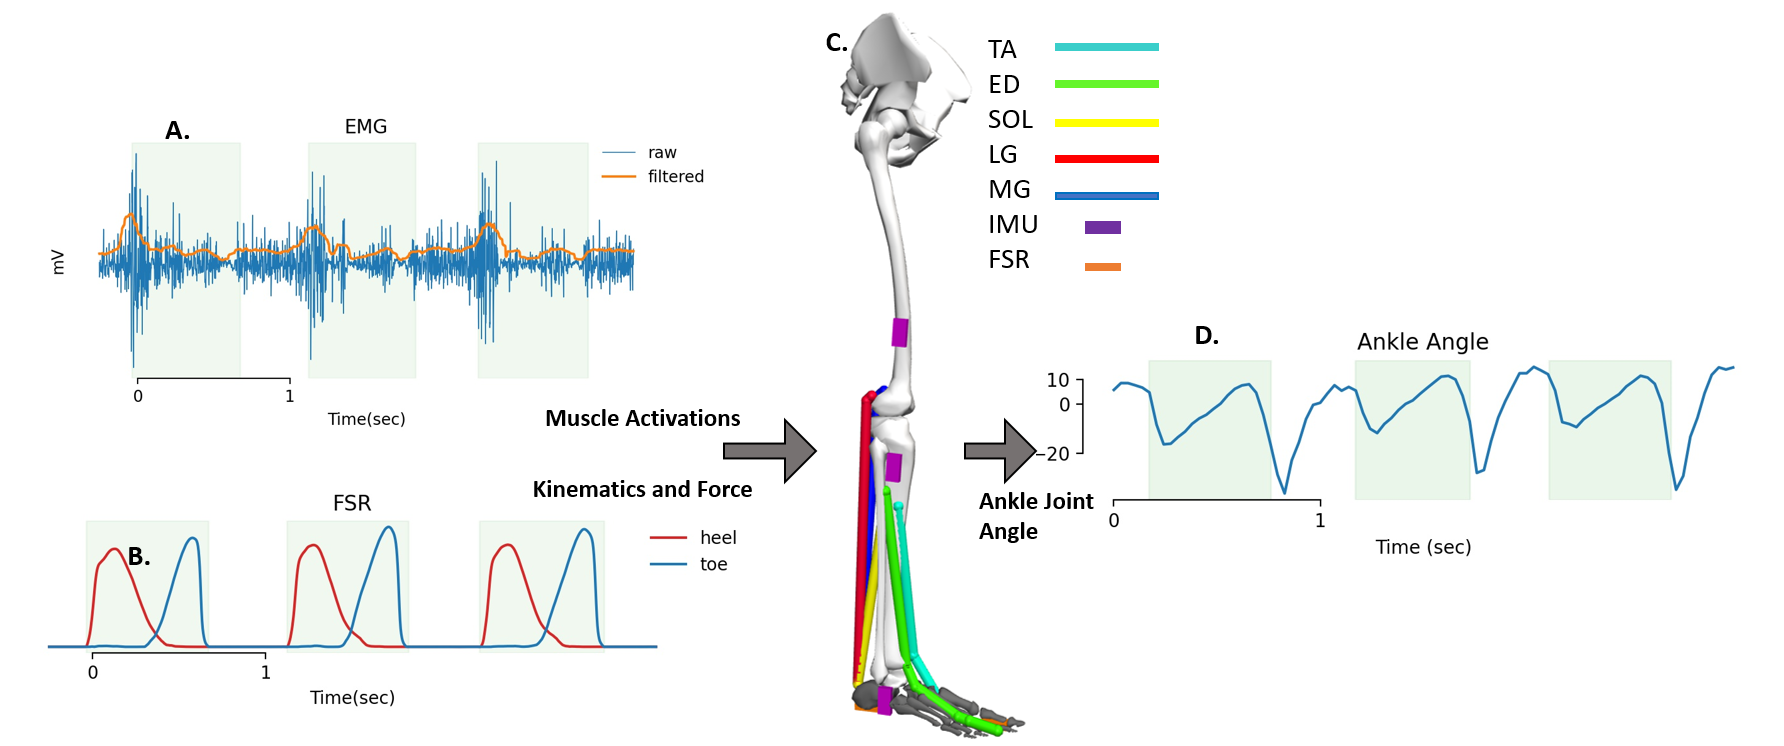
Fig: Schematic representation of musculoskeletal model framework . A) Sample raw and filtered EMG signal B Signal from FSR sensor
to detect swing phase of gait C) Musculoskeletal model schema with IMU placement and muscles. D) Predicted ankle angle as an output of the model.
Lower-limb amputees account for about 70% of an
estimated 185,000 new amputations
in the U.S. each year and 1 million worldwide. Current prosthetic systems lack natural
feedback and joint control, which, if available, are expected to improve prosthetic use,
mobility, balance and decrease limb and phantom pain. In this work we aim to address
this issue and my contribution is mainly in developing EMG decoding algorithm to
control ankle foot prosthesis with muscle activity and IMU.
In this study, a real-time neuromusculoskeletal(NMS) model of the lower limb with two degrees of freedom at knee and ankle joint was developed
to receive EMG and limb kinematic signals as input and predict ankle motion as output during target following tasks and swing phase of gait. Our results indicated that the real-time NMS model predicts
accurate ankle motion for various target speeds and positions. We also show the performance of the model in predicting ankle kinematics during the swing phase of motion and found mean peak correlation of 0.95
between predicted and measured motions across all subjects. The proposed modeling framework can be used for developing powered ankle prosthesis for transtibial amputees.
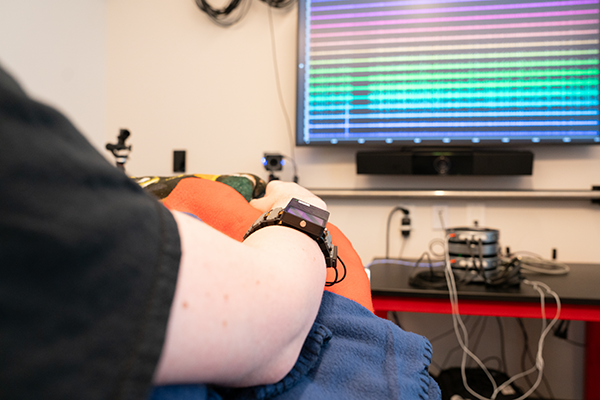
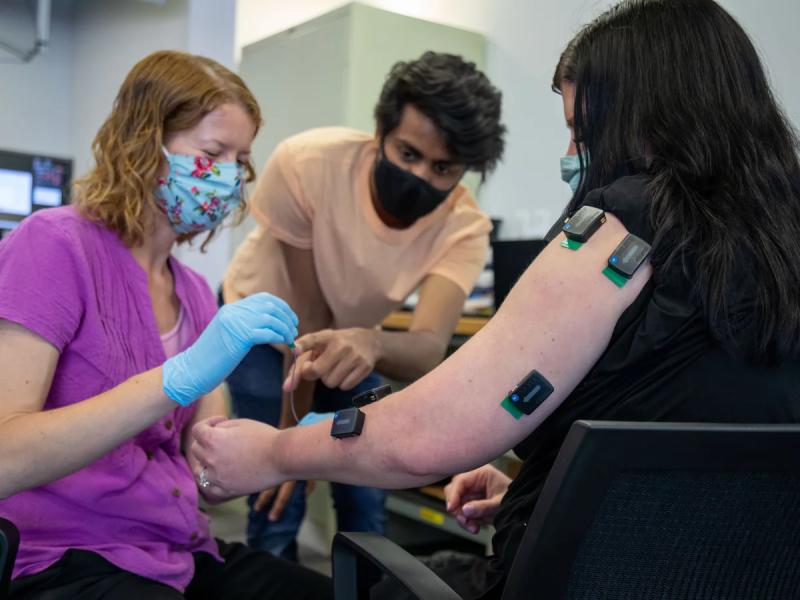
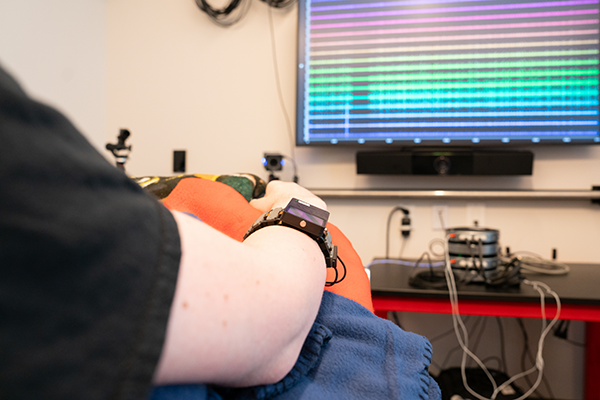
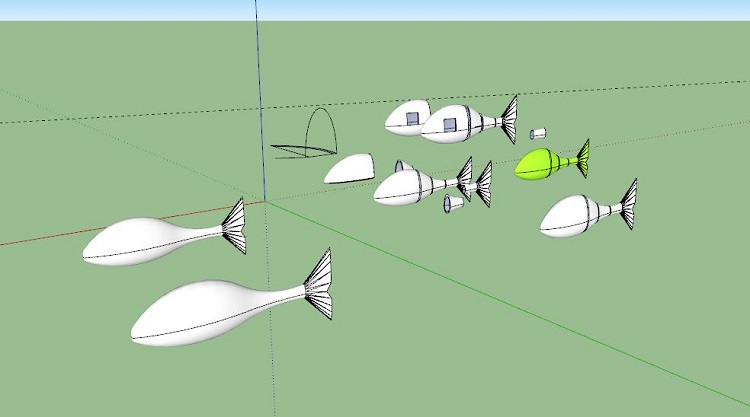
Fig: (Left) Testing the EMG-driven muscoskeletal model on healthy individuals. (Right) Validating the model on participant with lower limb amputation
Classifying Gait phases using IMU and EMG signal
Early Swing and Stance Phase were identified by the determining heel strike and toe-off
timestamp using the Force sensor placed on the heel and great toe. The Early and the
Late Swing phase transition was identified by the rotation of the shank along the
Talocrural joint axis using the X-axis of the Gyroscope placed on the Achilles tendon.
These Gait Phase identification parameters were used to label the data for performing a
supervised learning classification. The features used from the Kinematic data were the
mean of the maximum 20 sample values and the mean of the minimum 20 sample
values. The classification model used was Random Forest with 25% of the total data
used as the training data and the other 75% as the testing data. The classification
performed based on only Kinematic data yielded a total classification accuracy of 97%.
The EMG features used for classification were, the mean RMS value in each phase, the
maximum RMS value in each phase, the mean of the maximum half sample values of
the RMS EMG, and the mean of the minimum half sample values of the RMS EMG. The
classification using the Random Forest Classifier yielded 97% accuracy when 30% of
the total data was used as training data and the other 70% as testing data. For each of
the Kinematic and EMG data, dimensionality reduction was performed by finding two
principal components
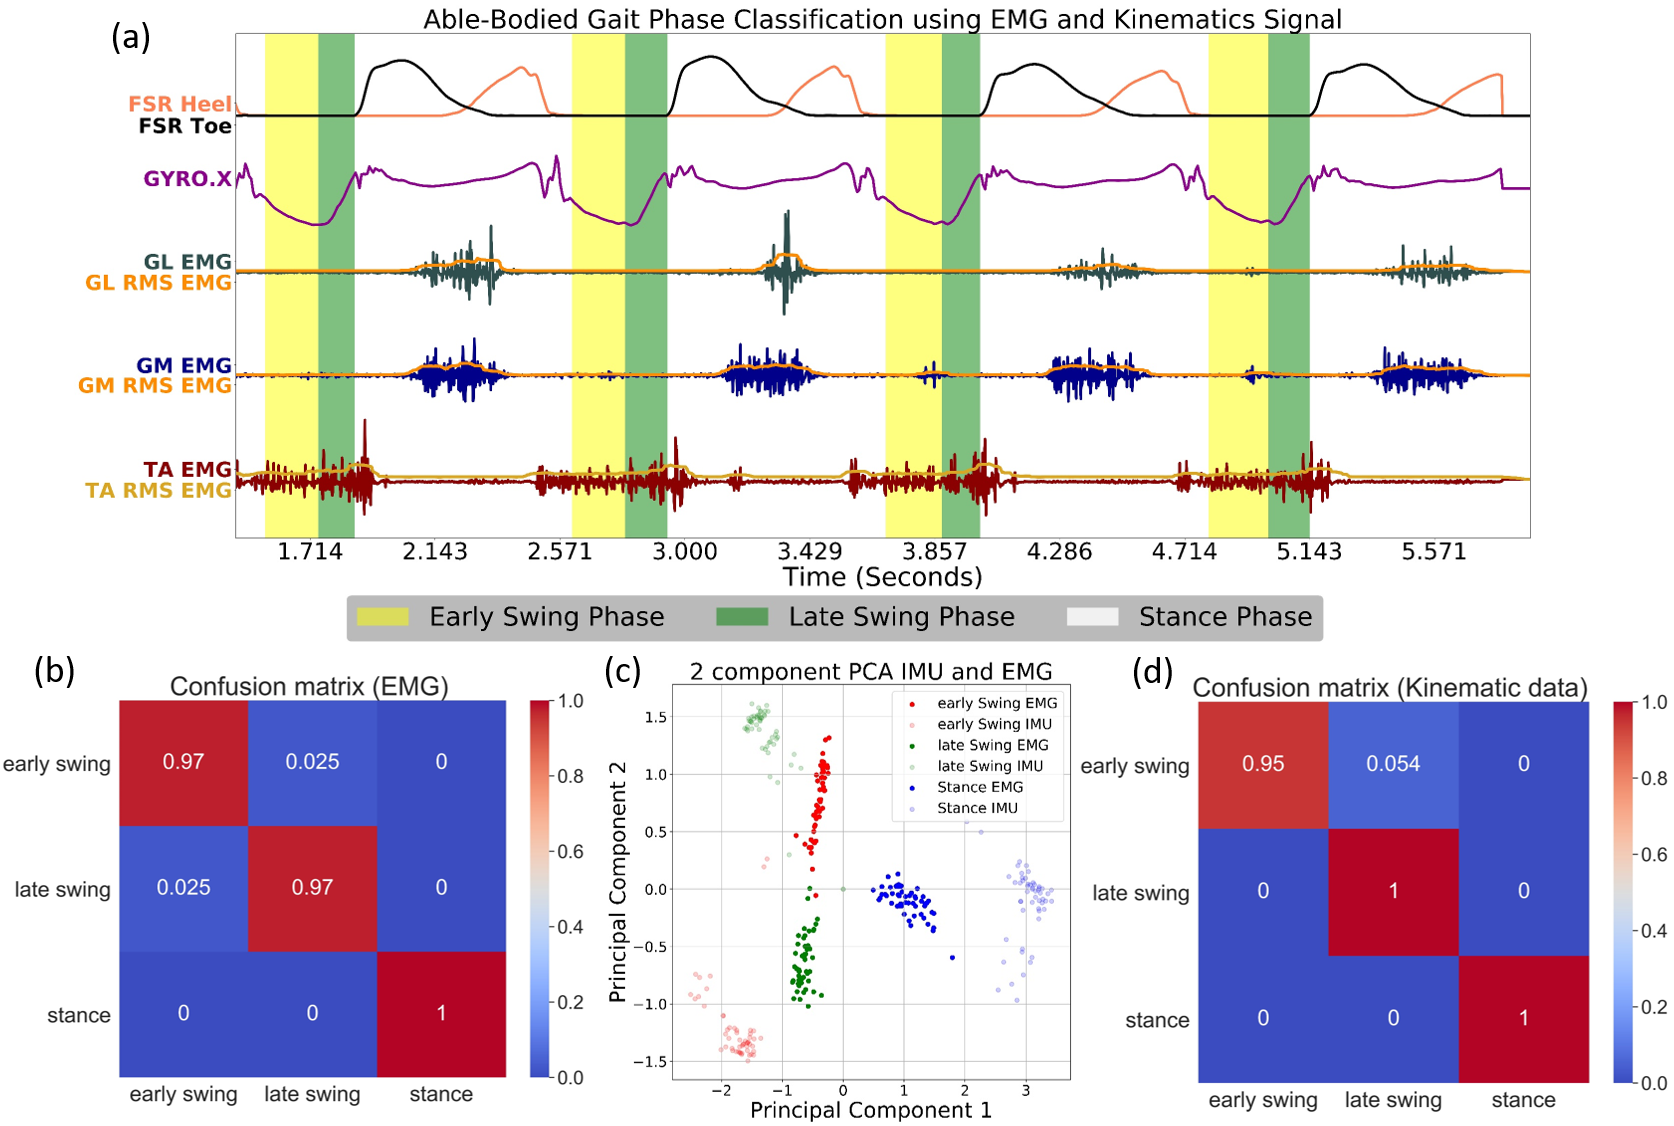
Fig: Able Bodied Gait Phase classification (a)
Time series Muscle Activations and alocrural joint
axis Gyroscope signal with identified gait phases marked. (b) Confusion Matrix for classification
of gait phases using only Kinematics data. (c) Comparison of Normalized 2 Principal
Components of Kinematics data and EMG data. (d) Confusion Matrix for classification of gait
phases using only EMG data.
In the next study, we examined the differences
in muscle recruitment between the intact and residual limbs of three transtibial amputees with the aim
of characterizing voluntary recruitment patterns. This study’s objective is to characterize patterns
of residual muscle recruitment by assessing the spatial and temporal corecruitment of muscles on the
residual limbs of transtibial amputees while performing volitional isometric movements (dorsiflexion,
plantarflexion, eversion, and inversion). We aim to analyze the pattern of recruitment of residual
muscles in comparison with the intact limbs. We report that while there is variability across
subjects, there are consistencies in the muscle recruitment patterns for the same functional movement
between the intact and the residual limb within each individual subject. These results provide
insights for how symmetric activation in residual muscles can be characterized and used for better
control of myoelectric prosthetic devices in transtibial amputees.
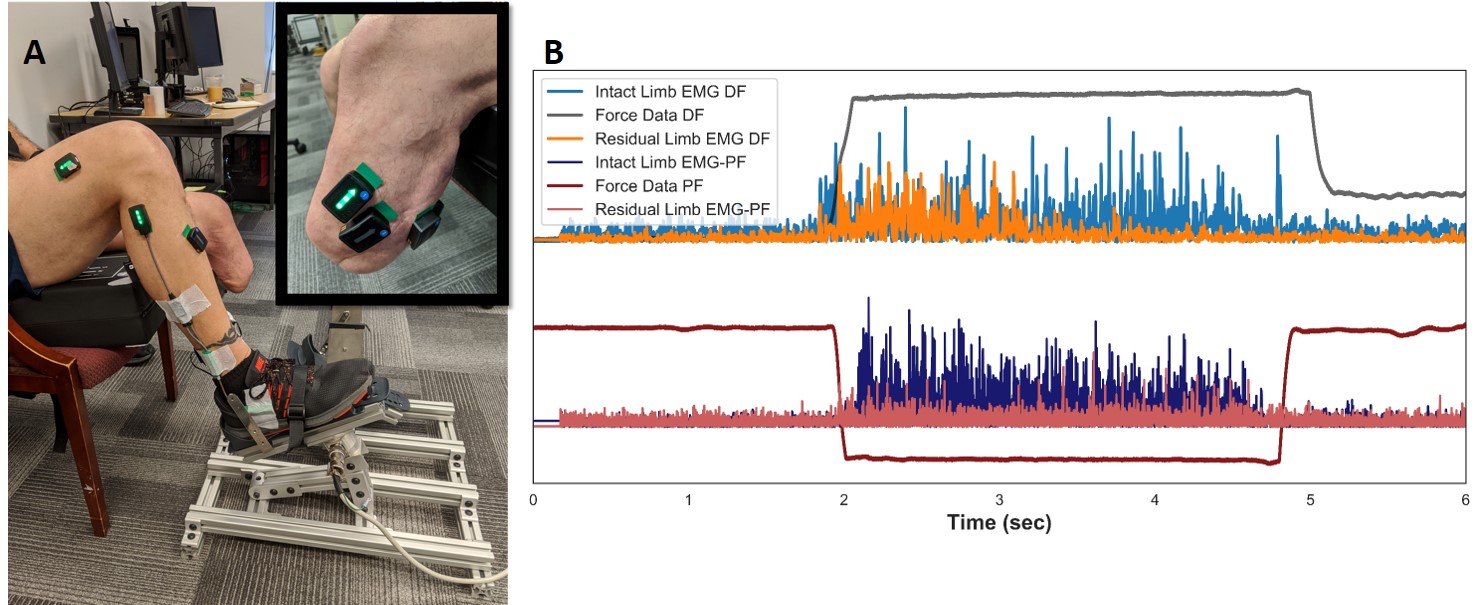
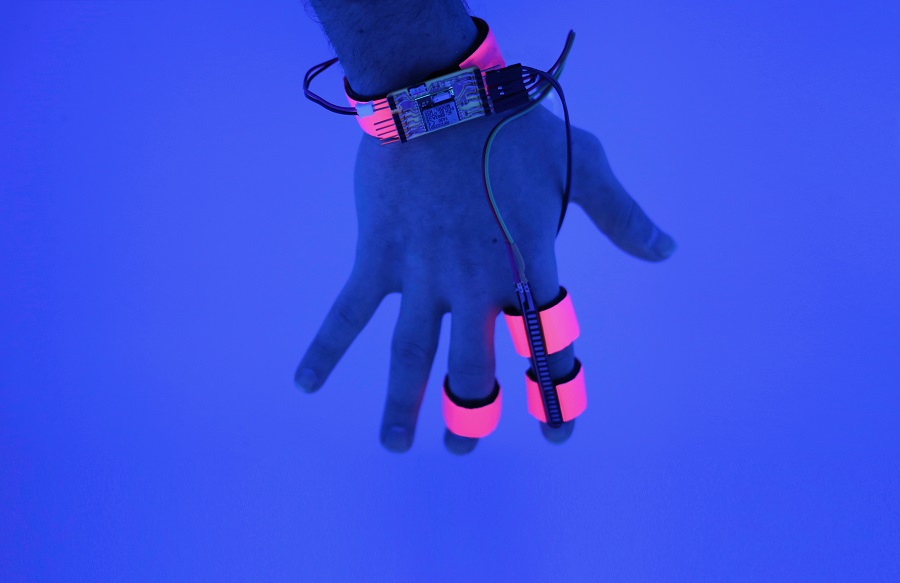
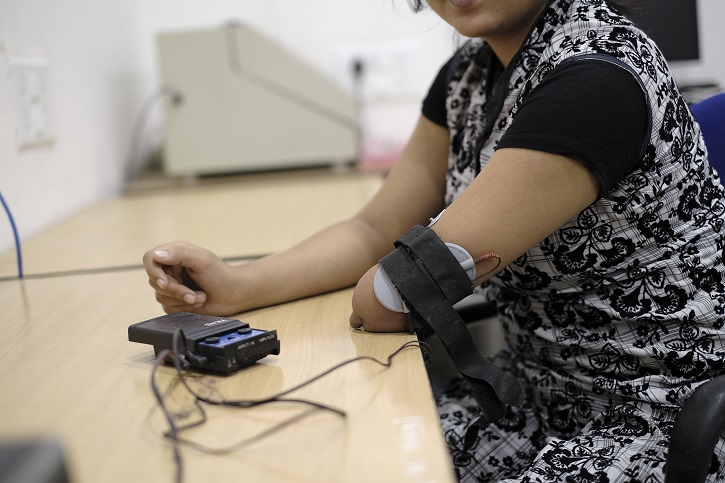
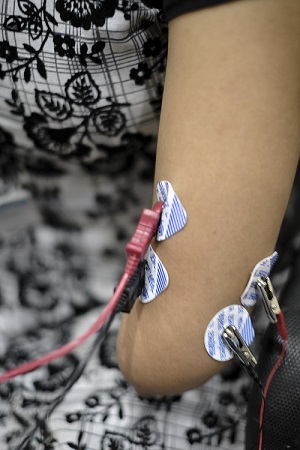
Fig: Experimental setup with Ankle Torque Rig
and EMG Placements: A) Subjects were aligned with their knee at 90 degrees to isometrically move
their intact ankle. EMG Sensors were placed over their major muscles on both limbs with a goniometer
at the intact ankle. B) Example traces of processed EMG data from the primary actors of the intact
and residual limb during Dorsiflexion (DF) and Plantarflexion (PF) are shown.
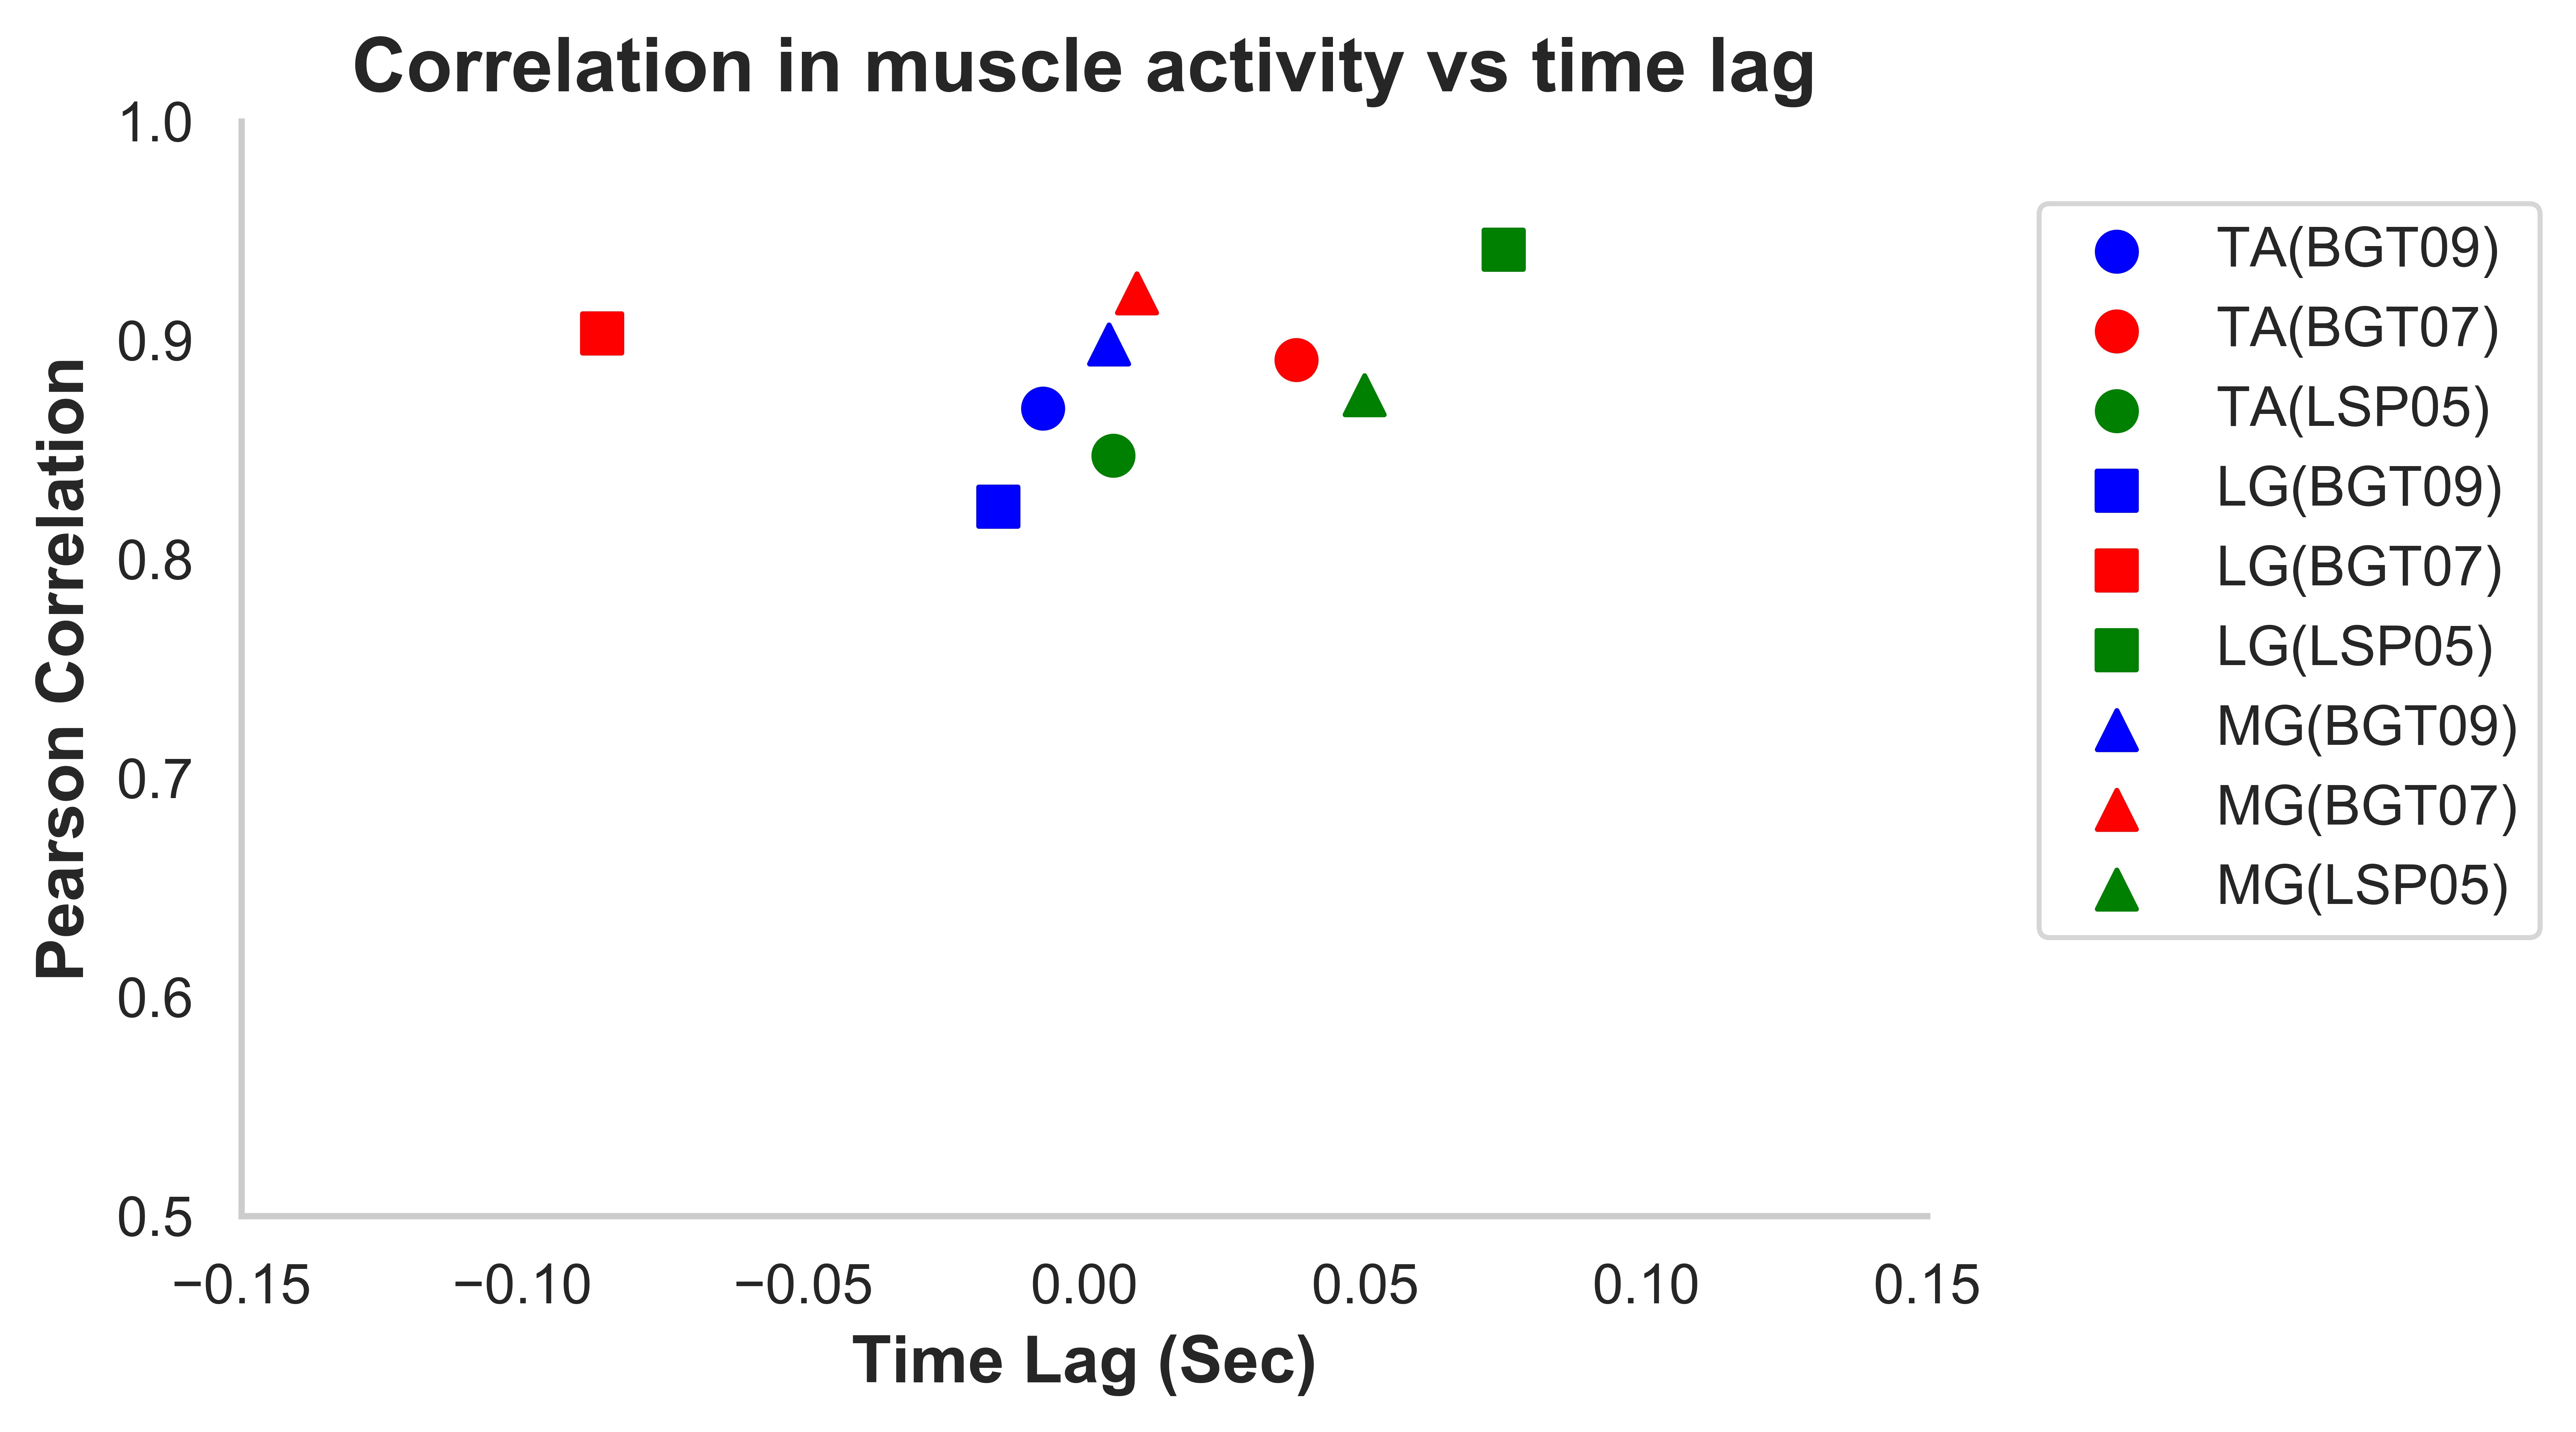
Figure 2: Temporal alignment and EMG amplitude
correlations between the 2 limbs. Mean-max correlations of the Intact vs Residual limb muscles
across all movements for each subject are shown against the time-lag at the time of maximum
correlation. Each symbol represents a muscle type and each color represents a subject.
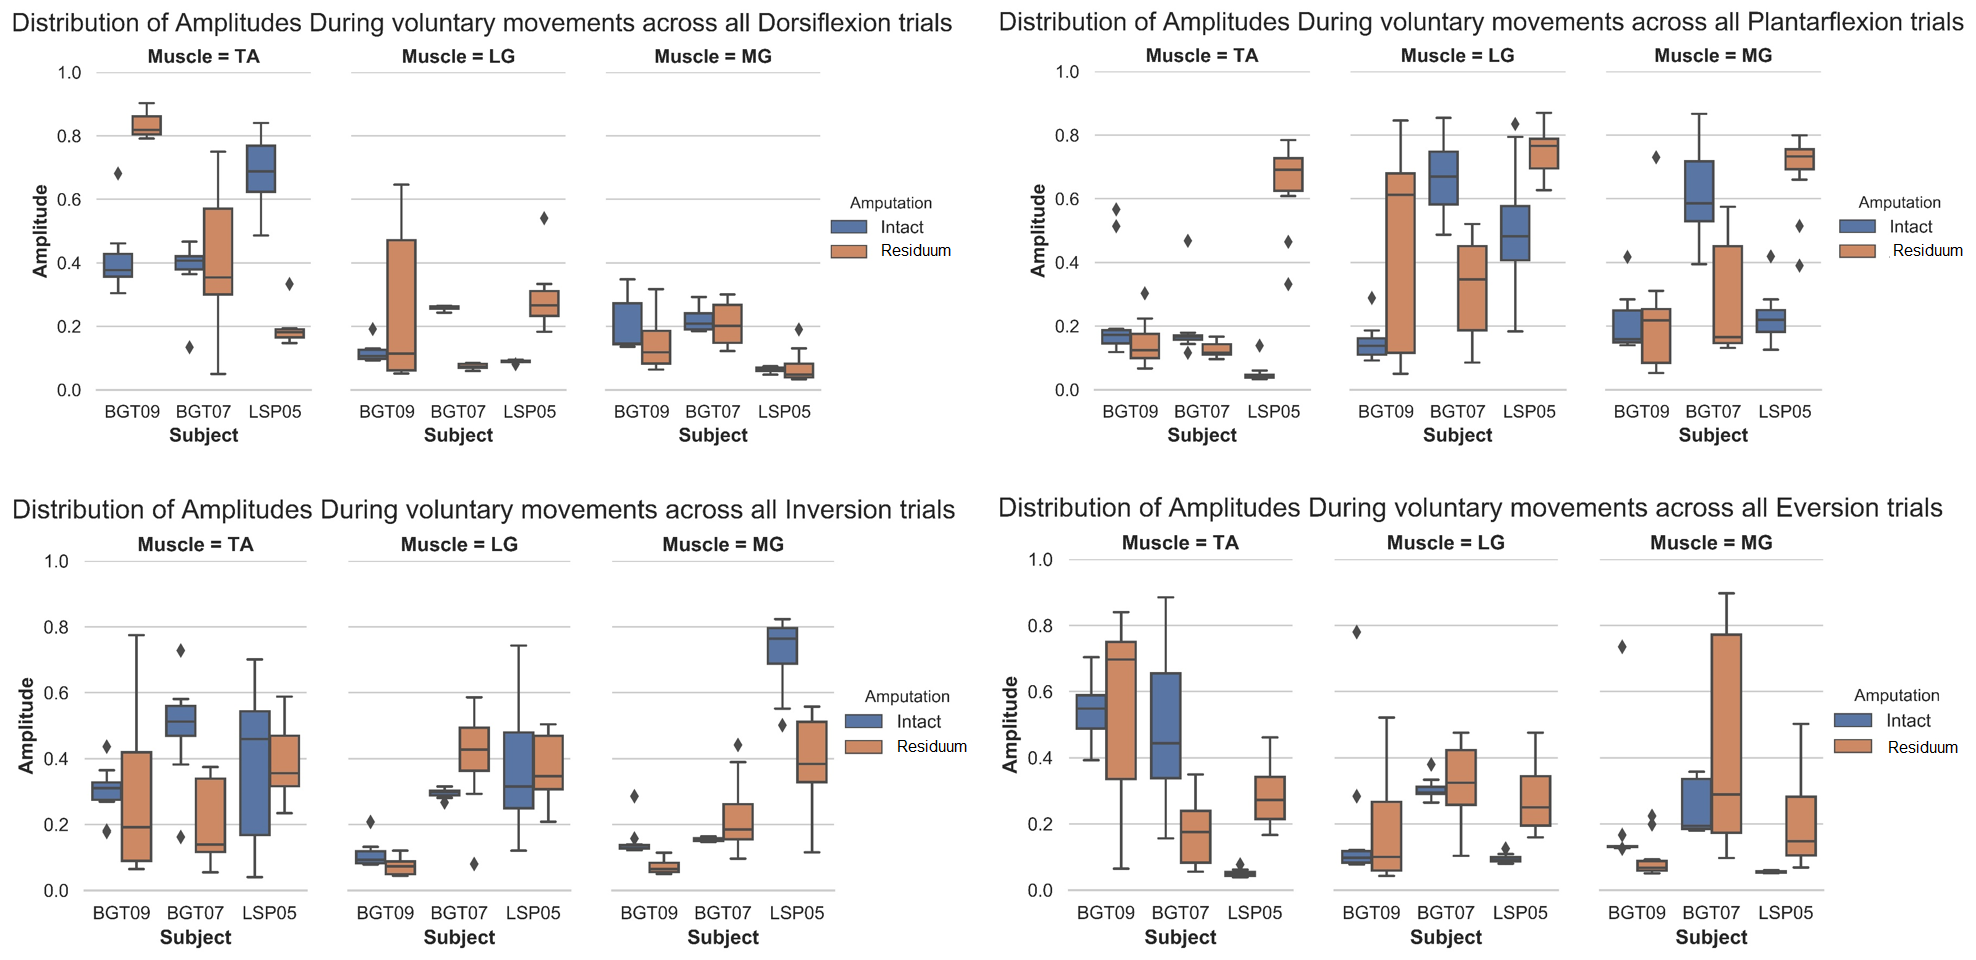
Figure 3: Comparison of Recruitment by Muscle
and Activity. Distribution of normalized RMS signal during the hold period. A, B, C, and D is for
each movement that is Dorsiflexion, Plantarflexion, Inversion and Eversion. Each diamond is the
outlier.